Table of Contents
Background
I began working on visual regression testing on June 4th, 2024. On August 5th, 2025—the day before my 31st birthday—I accepted all of a build’s screenshots for the first time. Thus ended 428 days of sporadic toil.
I’ve had the tests practically finalized for a while. Problem was, they were flaky. I tried reading Playwright documentation, tutorials, and best-practice guides. I long conversed with AIs. I even offered to pay $400 so that a professional would help me tidy up. The response was—and I quote—“this is 100% a trap lol… I’ve debugged playwright before and it’s not worth $400.” 
I was on my own, but hopefully I can transfer some of my painful learning. Here are the tricks I learned to keep my code clean, my tests reliable, and my site not visually regressed.

Best practices
To get started, here are two best-practices guides which I recommend:
- Official Playwright best practices, and
- Say Goodbye to Flaky Tests: Playwright Best Practices Every Test Automation Engineer Must Know.
For Playwright in general
- Don’t wait for a set amount of time
- Both
page.waitForTimeoutandexpect.pollrely on explicit timings. You should almost always use a better alternative. - Test approximate equality for scalars
- If you’re testing the
yposition of an element, useexpect(...).toBeCloseToinstead ofexpect(...).toBe. - Use
fullyParallelwith sharding - Parallelism within a single machine originally didn’t work for me due to other flakiness, but
fullyParallel: truecombined with heavy sharding on CI now works well. I run ~30 shards, each executing a few tests in parallel. - Lint, lint, and then lint some more
- Linting is not a luxury. My Playwright struggles went from “hopeless” to “winning” when I installed
eslint-plugin-playwrightto catch Playwright code smells. - Create a dedicated “test page”
- I can scroll my test page and see nearly all of the site’s styling conditions. The page is a living document, expanding as I add new formatting features or remember additional edge cases.
- Debug failures using Playwright traces
- Traces let you inspect every moment of the test. You can see the state of the dom before and after every Playwright command. On CI, save the traces as artifacts and use the
retain-on-failureoption. - Wait for spa navigation events, not url changes
- If your site uses spa navigation,
page.waitForURLresolves as soon aspushStatefires—long before the dom is ready. Instead, listen for a custom event that your spa dispatches after the dom morph is complete. Start listening before the trigger action so you never miss the event. - Beware browser-specific event ordering
mousemovemay fire slightly aftermouseenterwhen Playwright teleports the cursor. I had amouseMovedSinceNavflag that was set bymousemoveand read by themouseenterhandler to decide whether to show a popover. The bug:mouseenterfired first and saw the flag asfalse, so the popover was suppressed even though the user had genuinely moved the mouse. The fix was to read the flag inside asetTimeoutcallback (300ms later) instead of synchronously—by then,mousemovehad fired and set it.- Prefer feature detection over timing buffers
- When a browser quirk fires spurious events (e.g. Safari emitting
mouseenterafter an spa navigation morphs the dom under a stationary cursor), resist the urge to add a millisecond buffer like “ignore hovers for 500ms.” Instead, track whether the triggering condition actually occurred—e.g. amouseMovedSinceNavboolean that resets on navigation and flips onmousemove. The boolean is timing-independent and self-documenting. - Use
domcontentloadedinstead ofloadwhen possible - Firefox can stall on subresource loads (images, fonts) in CI, causing 30-second timeouts on page navigation. Using
domcontentloadedas the wait condition forpage.goto()avoids this. Only wait forloadwhen you specifically need all subresources to be ready. -
I hit an even nastier version of this on WebKit: my navbar has an autoplaying, looping background video (
preload="auto"). Its continuous range requests keep theloadevent pending indefinitely, sopage.goto(url, { waitUntil: "load" })stalled every navigation until the timeout—even though the server had already served every byte in milliseconds. If any page has autoplaying or streaming media,loadmay simply never fire in WebKit. Default your navigation helper todomcontentloadedand let each test assert on the concrete elements it needs afterward. - Guard WebKit autoplay with a watchdog
- Real Safari sometimes accepts
video.play()without error, then never decodes—readyStatesticks atHAVE_METADATAandcurrentTimestays 0, with no event to await. Re-issueplay()a few times on an interval, stopping once the video advances or the user pauses it. - Move the mouse to a safe position before visual assertions
- Using
page.mouse.move(0, 0)can overlap with navbar or menu elements on certain viewports (especially tablets), triggering spuriousmouseenterevents. Move the mouse to a position where no UI elements live. - Set
deviceScaleFactor: 1to eliminate subpixel jitter - Different CI runners may have different dpr settings, causing text subpixel rendering differences. Explicitly setting
deviceScaleFactor: 1in your config and usingscale: "css"in screenshot options normalizes this across environments. - Pin Chromium’s rendering to kill “ordinary” antialiasing drift
- Screenshots that shift by a tiny amount usually trace back to the CI runner’s font or graphics libraries shifting under an older baseline. Three Chromium launch flags:
--force-color-profile=srgb(fixed color mapping),--disable-lcd-text(grayscale instead of subpixel text antialiasing), and--font-render-hinting=none(no hinting-dependent glyph metrics).
For screenshots in particular
I use Playwright’s native toMatchSnapshot against baselines stored in Cloudflare R2 to examine screenshot deltas and judge visual diffs. No matter what tool you use, though, you’ll want your screenshots to be targeted and stable.
- Targeted screenshots only track a specific part of the site, like the different fonts. They don’t include e.g. the sidebars next to the fonts.
- Stable screenshots only change when the styling in question changes. For example, I often dealt with issues where a video’s loading bar would display differently in different screenshots due to slight timing differences—that is not stable. If the video didn’t appear at all, however, I would want the screenshot to reflect that.
It took me a long time to achieve these goals. Practically, I recommend directly using my visual_utils.ts. Here are screenshot lessons I learned:
- Use Playwright’s native snapshot apis with baselines kept out of git
- I take screenshots into a buffer and call
expect.soft(buffer).toMatchSnapshot(name). Baselines live in Cloudflare R2 (r2:turntrout/visual-baselines/)—tests/visual-baselines/is gitignored so the repo stays slim. CI downloads the current set into the local directory before running tests viarclone copy. Usingexpect.softlets every shot in a test report a diff in the html report instead of halting at the first mismatch. Avisual-approvedPR label triggers a workflow that re-runs with--update-snapshots=all, uploads the regenerated pngs back to R2, then pushes an empty commit so visual-testing reruns against the new baselines. -
Remember to pass
--update-snapshotswhen runningnpx playwright testto bootstrap baselines, or Playwright will error on missing files. - Target screenshots to specific elements
- Instead of taking a screenshot of the entire page, I take a screenshot of e.g. a particular table. The idea is that modifying table styling only affects the table-containing screenshots.
- Scrub media elements to deterministic positions
- Embedded audio and video elements fetch a varying number of bytes before the test takes a screenshot. That varying number of bytes means a varying “loaded” portion of the loading bar, creating a flaky visual difference. I scrub audio elements to the end (showing a fully loaded bar) and video elements to frame 0 (showing the first frame consistently). Use
MutationObserverinaddInitScriptto intercept media elements as the dom is parsed—disablingautoplayand settingpreload: "metadata"before any frames can advance.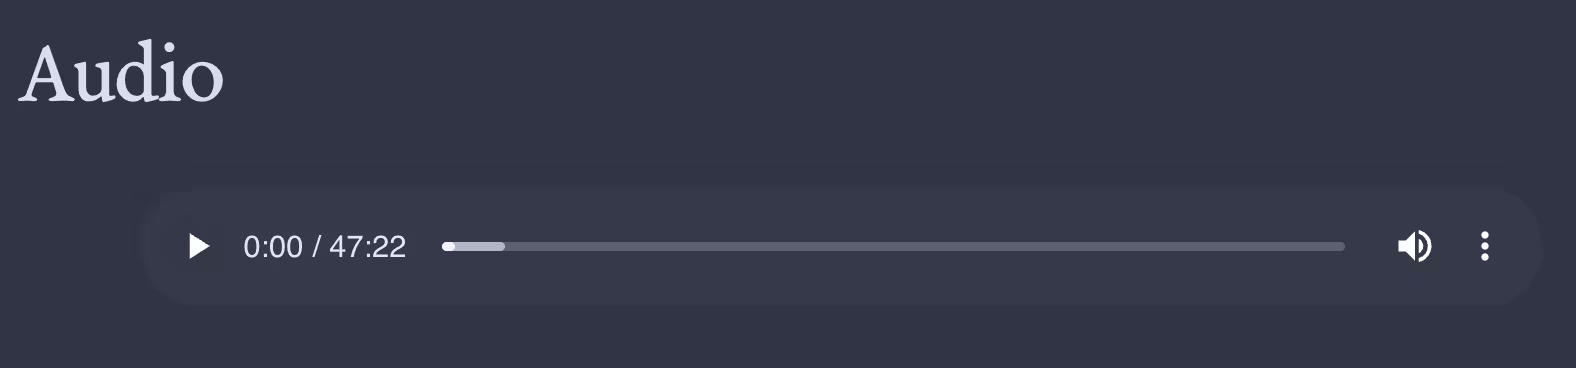
In the loading bar, the medium shade displays how much data has been fetched. - Verify videos are paused at frame 0 before screenshotting
- Even with autoplay disabled and an initial
pause()+currentTime = 0seek, slow CI runners can time out before theseekedevent fires—leaving the video at a non-zero frame. Usepage.waitForFunctionto poll each video element, re-issuingpause()andcurrentTime = 0on each poll iteration until the browser confirmspaused && currentTime === 0. This catches races that a single seek-and-hope approach misses. - Isolate the relevant dom
- While
toHaveScreenshotguarantees stability within a session, my screenshots were still wobbling in response to unrelated changes earlier in the page. For some reason, there were a few pixels of difference due to e.g. an additional line being present earlier in the page. -
I made a helper function which deletes unrelated parts of the dom. For example, suppose I have five
<span>s in a row. I want to screenshot the third<span>. The position of the first two<span>s affects the position of the third. Therefore, I edit the dom to exclude siblings of ancestors of the element I want to screenshot. I would then exclude the other four<span>s. - Mock the content
- When I take screenshots of site styling, they’re almost all of the test page content. The test page decouples site styling from updates to content around my site, ruling out alerts from “changed” screenshots which only show updated content.
- Use isolated fixture pages for visual regression testing
- I used to take screenshot of searching for the emoji section of the test page. However, test page modifications would jitter the screenshot, churning against baselines. I fixed this by writing fixture pages to decouple e.g. the search appearance from the specific (changing) content of the test page.
- Run WebKit tests on macOS, not Linux
- Playwright’s Linux WebKit engine (wpe) is not the same as real Safari. Wpe is flaky. The Playwright team recommends running WebKit on macOS for Safari fidelity. I split my CI into Linux jobs (Chromium & Firefox) and macOS jobs (WebKit only).
- Know when to give up
- In my visual regression testing, there are five or so discrepancies between the CI screenshots and the local screenshots. I tried for at least an hour to fix each discrepancy, but ultimately gave up. After all, visual regression testing just needs to tell me when the appearance changes. I’ve just approved those screenshots and kept an explicit list of what’s different.

Find out when I post more content: newsletter & rss